 In the previous article (CONECtrónica number 93, January 2006, pp. 12-14), the procedure for performing the optoelectronic characterization of a laser diode was explained, using a LIV test system. This test is of great importance for checking for possible malfunctions in the devices, as well as obtaining their modulation curves.
Next, this article will extend the analysis to the spectral parameters of optical sources, for which an optical spectrum analyzer (OSA) will be used. The accuracy of the measurements depends largely on the correct calibration of the instrument, so one of the procedures used for calibrating optical spectrum analyzers will also be briefly discussed.
Spectral characterization of an optical source
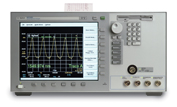
 As mentioned, an optical spectrum analyzer is used for the spectral characterization of an optical source. This measuring instrument allows for the determination of multiple source parameters, such as center wavelength, peak power, noise spectral density, bandwidth, mode separation, and so on. Almost all analyzers cover a wide wavelength range (e.g., 600 to 1700 nm), making it possible to measure any of the optical sources used in communication system transmitters (first, second, and third transmission windows). Depending on the type of source, the measurements required can vary considerably, as specific characteristics must be considered in each case. Some of these characteristics are summarized below.
DFB Lasers.
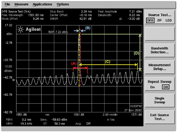
In DFB lasers, the main parameters to be measured are: peak wavelength, peak amplitude/power, bandwidth suppression (A), center shift (B), mode shift (C), bandwidth, bandwidth suppression, and mode suppression ratio (D) or SMSR (side mode suppression ratio). Figure 1 shows, as an example, the spectrum of a DFB laser along with its characteristic parameters measured with an optical spectrum analyzer. Some of these parameters are also represented graphically in the same figure.
 Fabry-Perot Lasers
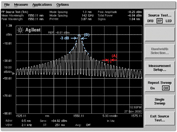
Unlike the DFB laser, the spectrum of a Fabry-Perot laser is composed of a whole series of longitudinal modes. In this case, the typical parameters that are usually measured are: peak and average wavelengths, peak amplitude/power, total power, mode spacing (A), FWHM (B), and sigma. The sigma parameter is defined as the RMS value of the spectral width and is given by FWHM = 2.355 x sigma. Figure 2 shows an example of a measurement for a typical Fabry-Perot laser.
LED
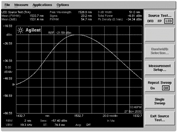
Finally, another very characteristic type of optical source is the LED. Its main spectral parameters are: peak wavelength, FWHM, sigma, total power, or peak power density. Figure 3 shows the spectrum of an LED along with the measurement of its characteristic parameters. When measuring an LED on an optical spectrum analyzer, the source's spectral width is much larger than the analyzer's resolution bandwidth (RBW). Therefore, the trace points represent power spectral density values (mW/nm) and not absolute powers. In the case of the measurements in Figure 3, the peak power density has been specified for a bandwidth of 0.1 nm.
 Spectrum Analyzer Calibration:
To perform precision measurements such as those discussed above, it is essential that the analyzer is perfectly calibrated. This is always done before purchase, although periodic calibration is recommended in many cases. One typical procedure involves using gas cells as wavelength reference sources. A gas cell simply consists of a tube filled with a gas or gas mixture of known purity and pressure. Fiber optic cables are usually attached to this tube, and a broadband optical signal (typically from an ASE noise source) is passed through the device. Since gas molecules are characterized by a series of absorption lines located at specific and known wavelengths, the optical output spectrum of the gas cell can be used as a reference source for calibrating an optical spectrum analyzer. Furthermore, as an added advantage, these absorption lines are very stable against changes in environmental conditions, such as variations in temperature and pressure or the presence of electromagnetic fields.
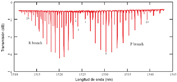 The acetylene (C2H2) cell is one of the main wavelength references for the C band, as its absorption spectrum covers the range from 1510 to 1540 nm. The NIST (National Institute of Standards and Technology), the United States government standards agency, has a series of reference notes (SRMs, Standard Reference Materials) that outline the characteristics gas cells must meet to be certified as reference sources for calibrating optical instruments. For example, SRM2517 is used for the acetylene cell. The absorption spectrum of one of these cells is shown in Figure 4 (Manufacturer: Wavelength References). As can be seen in this figure, there are several absorption peaks at specific wavelengths. The wavelength accuracy is approximately 0.3 pm, and its variation with temperature is less than 0.01 pm/°C. Precisely because of these characteristics, and also due to their low cost, acetylene cells constitute a very suitable device for the calibration of optical spectrum analyzers.
Author:
Francisco Ramos Pascual. PhD in Telecommunications Engineering
Full Professor at the Polytechnic University of Valencia