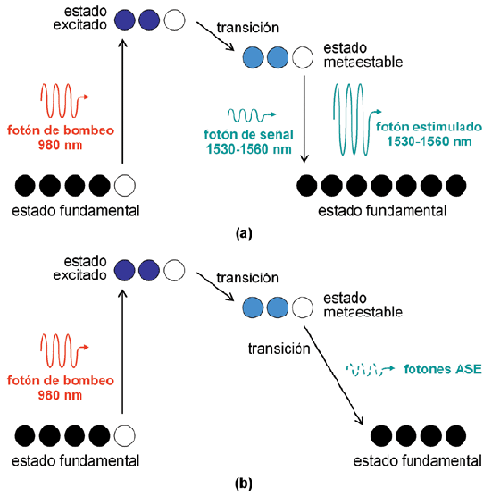
Amplified spontaneous emission (ASE) noise is a typical degradation factor in long-distance optical communication links using optical amplifier chains (usually EDFAs). Each amplifier generates noise at its output, which accumulates and is amplified in subsequent amplifiers, potentially leading to saturation. The signal amplification and ASE noise generation processes in an EDFA are schematically described in Figure 1. Figure 1(a) illustrates the desired signal amplification behavior, whereby erbium ions are excited using a pump wavelength (980 nm) and transition to a metastable state. From this state, the signal photons cause them to return to the lower-energy ground state, resulting in stimulated amplification of these photons. However, some of the excited erbium ions decay to a lower energy level before they can combine with a signal photon, resulting in the emission of a photon with random phase and direction, as illustrated in Figure 1(b). These photons are precisely what contribute to the generation of a broadband ASE spectrum. But what is usually seen as a detrimental phenomenon can have interesting applications, such as the one described in this article.
Characterization of CWDM and DWDM Devices:
The proper functioning of optical systems and networks based on wavelength multiplexing requires monitoring the spectral response of filters, isolators, circulators, multiplexers, demultiplexers, switches, and attenuators. Specifically, it is important to know their center wavelength, bandwidth, channel isolation, band ripple, and insertion loss, among other characteristics. Several methods exist for characterization. For example, a dedicated laboratory instrument can be used, or a wavelength scan can be performed with a tunable laser, and the output power measured. The disadvantage of both methods is that they are usually expensive. As an alternative, a quick and simple method for performing this function is proposed below.
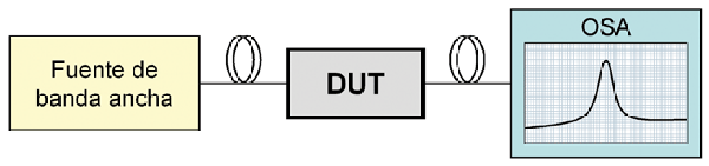
The laboratory setup is shown in Figure 2. It consists of a broadband source to which the device under test (DUT) and an optical spectrum analyzer (OSA) are connected. An OSA is readily available in almost any laboratory, so the only additional cost is for the optical source. There are several options for the optical source, such as a superluminescent LED (SLED), an ASE source, or a supercontinuum. For cost-performance reasons, the best option is the ASE source, which can provide a fairly broad spectrum at a reasonable power level.
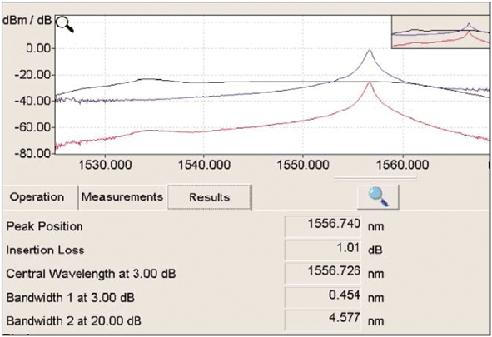
 The measurement process is simple. First, a reference trace is captured on the OSA without the DUT, i.e., by connecting the source output directly to the OSA. Then, the measurement is repeated with the DUT inserted. The difference in dB between the two traces represents the spectral response of the DUT. Figure 3 shows an example of this measurement. Depending on the parameters to be characterized, a specific wavelength range, resolution bandwidth, etc., will be used. The quality of the measurement will largely depend on the type of OSA used (wavelength accuracy, dynamic range), as well as the optical source. The main source characteristics to consider are described below.
Source Selection
When selecting a broadband source for component characterization, and specifically an ASE source, it is important to consider several characteristics such as total power, peak power, and spectral density. Total power, measured in dBm or mW, refers to the source's total integrated power, that is, the power that would be displayed on a power meter connected directly to its output. Peak power, on the other hand, refers to the highest power level in its spectral distribution as measured by an OSA. In this case, the resolution bandwidth value for which the measurement was taken must also be provided. Finally, power spectral density (in dBm/nm) refers to the power of the spectrum integrated into 1 nm slits. This characteristic is usually measured with an OSA configured with a resolution bandwidth of 1 nm, so the spectral density will vary with the wavelength. The power spectral density value is important because it limits the dynamic range of the measurement when using grating-based OSAs. For example, consider a broadband source with a relatively flat power density of approximately -10 dBm/nm. If we perform the measurement with an OSA with a 0.1 nm resolution bandwidth, this implies that the reference power will be approximately -20 dBm. If we then connect a DUT with 50 dB of insertion loss, this would result in a measurement of only -70 dBm for the 0.1 nm resolution of the OSA. Therefore, in the case of high insertion loss, there will be a limitation on the minimum resolution bandwidth that can be chosen.
 But in addition to the source's power levels, its stability, defined over a specific period, is also important. In this case, ensuring the stability of the total power is relatively straightforward, but not the spectral density. Due to the nature of ASE sources, energy transfers from one wavelength to another often occur. These power variations in the spectral slots lead to measurement inaccuracies. Therefore, for characterizing DWDM components, where precise and repeatable measurements are required, controlling this performance parameter is crucial.
Finally, the wavelength range that can be covered is also a characteristic that requires attention. Typically, an ASE source provides a good signal level in the C and L bands, where Erbium amplification primarily occurs. In contrast, a SLED is less powerful than an ASE source but can cover a wider selection of wavelength ranges. This range of wavelengths is especially important when characterizing CWDM components, as they typically operate in wider bands.
 Commercial Equipment
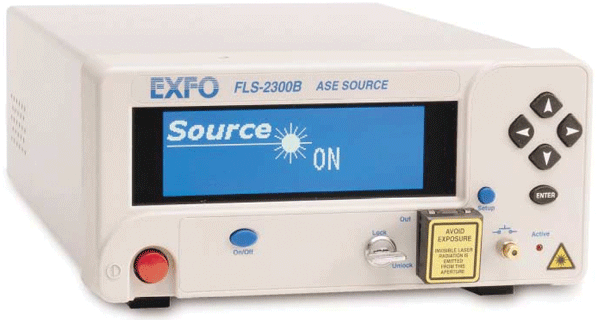
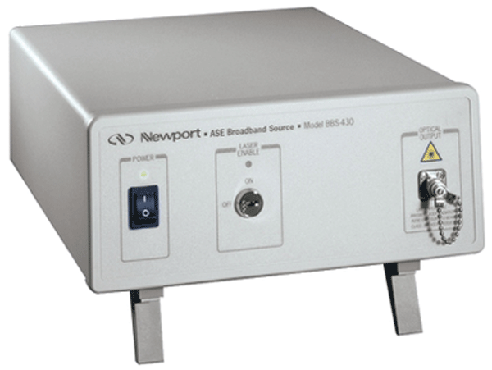
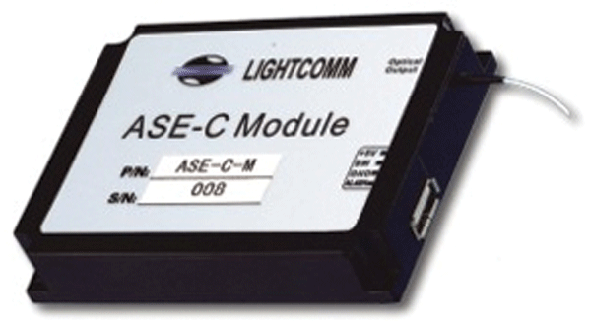
Having discussed the basic principles of measurement, we will now provide some examples of ASE sources available on the market. As a first example, Figure 4 shows the EXFO FLS-2300B source. This high-performance ASE source is characterized by an output power exceeding +14 dBm and a spectral stability of ±0.04 dB/nm (15 minutes) in the 1520 to 1560 nm range. The device is available with a flattened gain option. Another company that offers broadband sources for component characterization is Newport Corporation. In this case, they offer a broadband ASE source (1000-1650 nm) with an output power of +13 dBm and good spectral stability (Figure 5). Finally, several manufacturers offer small-sized ASE modules in their catalogs. For example, one of these can be seen in Figure 6. In this case, it is a C-band (1525-1565 nm) module with an output power of up to +15 dBm and a spectral stability of ±0.05 dB/nm.
Francisco Ramos Pascual. PhD in Telecommunications Engineering
Full Professor at the Polytechnic University of Valencia