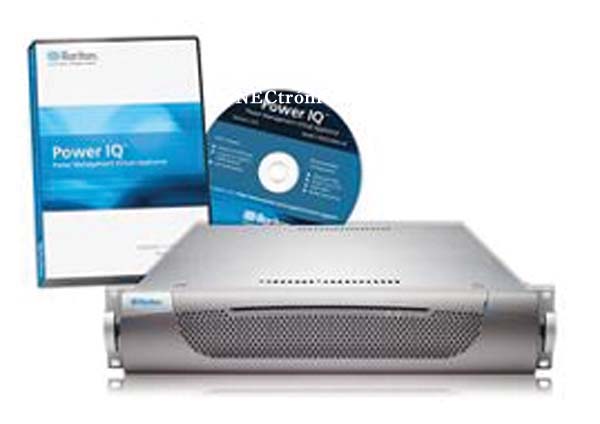
The Power IQ energy dashboard displays complex information in easy-to-view reports, charts, thermal graphs, and maps. The new forecasting chart, for example, provides "days of supply" information and helps determine available power at any level (data center, plant, room, row, or rack). Power IQ also provides real-time information on energy usage, energy costs, carbon footprint, and thermal factors.
“Power IQ 3.0 tools empower a much larger group of users to view and access key data center information in a useful way,” says James Cerwinski, Senior Manager, Raritan Power Management Business. “The dashboard can be configured differently to meet each user’s customized information needs. We want customers to be able to personalize their desktop so they can easily access the information they want, when they want it. Some customers will deploy the dashboard on large displays in their workplace, creating a NOC zone, or on hallway displays for customers to view, in an effort to raise awareness of data center energy consumption.”.
Key features of the Power IQ 3.0 energy dashboard include: configurable design and size; trend and forecast charts, health status and events; and a slideshow mode with real-time updates. Videos, images, and widgets from the Weather Service can now also be embedded in the dashboard.