 Business survival. This involves threats to business reputation, including attacks from both inside and outside the company, theft/loss, the use of insecure policies, fraud, etc., which lead to identity theft/exposure. For example, LulzSec published usernames and passwords it had stolen from Sony through cyberattacks. We also see many companies and institutions experiencing retaliation from dismissed employees or staff who dislike or even hate their superiors. Finally, companies are obligated to implement legal compliance processes, including mandatory laws and regulations such as the LOPD-RMS (Organic Law on Data Protection, Regulation of Security Measures to protect against the theft of PII - Personally Identifiable Information), PCI-DSSv2 (for electronic transactions), HIPAA, GLBA, SOX (Sarbanes-Oxley Act, auditor independence), etc. It is observed that some companies prefer to pay fines rather than professionally implement the technical requirements that allow them to comply with the demands; these oversights can affect interconnected third parties (business partners) who comply with the laws and regulations. (2) Underground economy.
According to the 2011 Symantec Norton Report, organized crime cybercrimes cost more than the drug trade. Botnets like Zeus, which combine spam and phishing, can generate up to $9.4 million (Clusif-2011). Other areas include pornography and cybercrime, where in 2011 the number of victims worldwide was 431 million, generating $114 billion in revenue (Symantec-2011). (3) Cyberwarfare. This includes attacks on critical infrastructure and industrial facilities. For example, the Stuxnet worm, an industrial threat targeting Iranian nuclear facilities; the suspected Chinese attack on G20 files in Paris (BBC-2011); and the attack on DigiNotar by Black Spook and Iranian hackers, in which more than 200 illegitimate certificates were extracted from DigiNotar's Certification Authorities (F-Secure-2011). (4) Hacker-activists. These are individuals who are members of specific protest groups. They can be considered dangerous because some of their actions may constitute cybercrimes, and governments fear their civil disobedience. Where we find actions such as: Wikileaks (we want to know; leaks information to the media), the Anonymous group that defends acts it considers unjust by carrying out DDoS attacks against sites such as Paypal, Amazon, Visa/Mastercard (Operation Payback), Twitter, the Tunisian government (against censorship), the US government (for the SOPA Act), the LulzSec group (attacks the CIA website with DDoS, steals passwords from Sony (using SQL injection), Nintendo, X-Factor, etc.
Economic Feasibility.
One approach that can be used for any implementation of information protection safeguards and controls is the economic feasibility of the implementation. This begins by evaluating the value of the information assets to be protected and the potential loss in value if the security and privacy of those assets are compromised. It is clear that any company or organization should spend more to protect its most valuable assets. The formal process is called Cost-Benefit Analysis (CBA) and allows for the quantitative calculation of economic feasibility. Some of the elements that impact the cost of a control or safeguard are: (i) The cost of development or acquisition. (ii) Training fees. (iii) Implementation costs. (iv) Service costs. (v) Maintenance and upgrade costs. The benefit is the value that the company recognizes by using the controls to prevent losses associated with a specific vulnerability or threat. This is typically determined by valuing the set of information assets exposed to risk and then determining their value if they are at risk. Asset valuation is the process of assigning a financial value to each information asset. Asset valuation involves estimating the actual and perceived costs associated with the design, development, installation, maintenance, protection, recovery, and defense against market loss for each set of information assets and the systems related to those assets. There are many components to asset valuation. Once the value of the various assets has been estimated, the potential for loss due to exposure to vulnerabilities or the occurrence of threats is examined. This process generates an estimate of the potential loss per risk. Key questions at this stage include: What damage could occur and what financial impact would it have? What would it cost to recover from an attack, in addition to the costs mentioned above? What is the Single Loss Expectancy (SLE) for each risk? The expected value of a loss, or ALE (Annualized Loss Expectancy), can be calculated as: ALE = SLE x ARO, that is, the product of SLE multiplied by ARO (Annualized Rate of Occurrence), where SLE can be obtained as: SLE = Asset Value x EF, that is, multiplying the asset value by EF (Exposure Factor). ARO represents the frequency (how often) a specific type of attack is expected to occur per year. SLE is the calculation of the value associated with the most probable loss from an attack. EF represents the percentage of loss that would occur if a given vulnerability were exploited (however hidden it may be; for example, an obscure port number could allow stealthy access to a server or leave a debug mode in an application for clandestine access; the solution is to perform a code audit). The CBA (Cost-Based Analysis) allows you to determine if the security control alternative being evaluated is worthwhile in relation to the associated cost of controlling the specific existing vulnerability. Economic feasibility, also known as ANB (Annualized Net Benefit) or CBA, can be calculated from ALE (Annualized Loss Expectancy) by subtracting ALE-after from the ALE-before and ACS, i.e.: ANB = CBA = (ALE-before – ALE-after – ACS), where ALE-before represents the ALE of the risk before the implementation of the control or protection system. ALE-after represents the ALE calculated after the control or protection system has been in place for a period of time. The ACS (Annual Cost of the Safeguard) can be calculated as ACS = ((Safeguard Cost / Number of Years of Life) + Annual Maintenance Cost), i.e., by adding the annual maintenance cost to the quotient of the safeguard cost divided by the number of years of life. If the ANB is positive, the protection safeguard being evaluated is cost-effective; if it is negative, it is not.
Given a primary e-commerce web server (valued at €6,000), its security may be compromised, rendering it unavailable. If the EF value is considered to be 75%, then SLE = €6,000 x 0.75 = €4,500 is the amount allocated to the security event if it occurs; that is, it is the cost of a single instance of the website becoming unavailable. ARO is the estimated frequency with which the event may occur. If the ARO is estimated to be three times per year (based on the types of vulnerabilities and threats that are known and documented related to the server type), then ALE can be calculated as the product of SLE and ARO; in this case, the result is €13,500.
 Another alternative strategy to CBA (which uses the financial value of information assets) is benchmarking (BM), which involves reviewing similar companies or professional institutions from the perspective of their business model and level of protection to determine what they do to protect their assets. When a company conducts benchmarking, it should use measures: (i) Metric-based measures, which are comparisons based on numerical standards. (ii) Process-based measures, which examine the activities performed in pursuit of their objective rather than the specifics of how the objectives were achieved.
Threat Categories. Jump Rate. Risk Exposure.
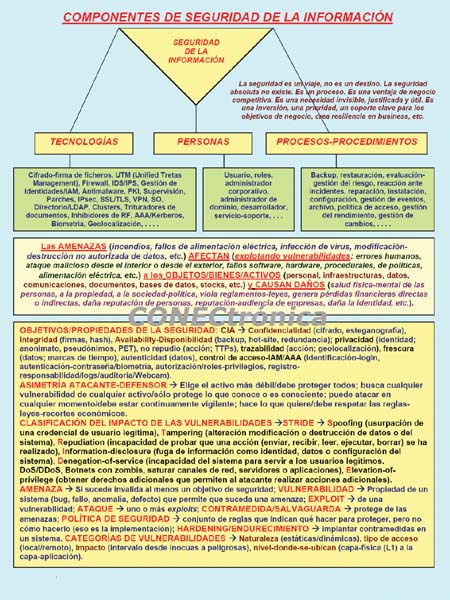
Some threat categories are: (1) DoS/DDoS attacks. (2) External system penetration (e.g., exploiting database vulnerabilities using SQL injection attacks). (3) Data-level sabotage. (4) Theft/leakage of intellectual/industrial property information (using spyware, exploiting DNS vulnerabilities, or poisoning the ARP cache). (5) Unauthorized access by internal entities. (6) Malware, viruses, worms, Trojans, spam, pharming, phishing, keyloggers, and dialers. (7) Passive (sniffer) and active (MITM) eavesdropping. (8) Misuse of resources (unintentional or malicious ineptitude). (9) Natural (earthquake, flood, etc.) or man-made (bombing, arson) incidents/catastrophic disasters. (10) Accidental or deliberate failure of electricity, hardware, network, etc.
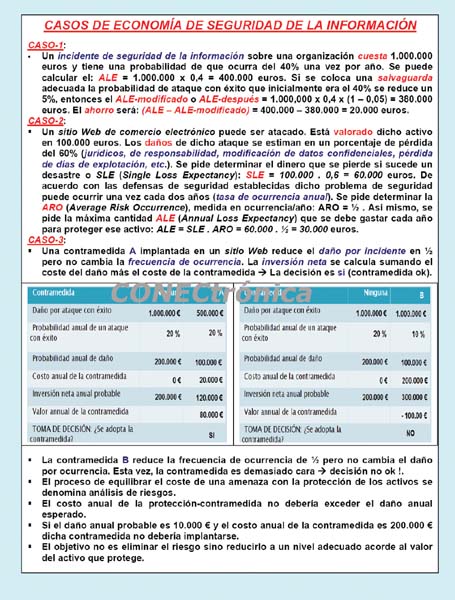
Consider company NZPQ, which currently has a 60% probability of experiencing a Category A misuse security incident and a 30% probability of experiencing a Category B incident. Determine the percentage of risk exposure if no safeguards, protective measures, or risk mitigation actions are implemented. In this case, the baseline risk of Category A is 60%, and the baseline risk of Category B is 30%. Therefore, the safety margin is obtained by multiplying the results of one minus 60% by one minus 30%, which equals 28%. Thus, the risk exposure if no security measures are taken is obtained by subtracting one minus the safety margin, resulting in a 72% risk exposure. Suppose the company implements measures to mitigate Category A and Category B incidents; determine the resulting risk exposure. Let's assume the security solution for mitigating Type A incidents is highly efficient, exhibiting a 5% bypass rate (the bypass rate of a security solution or safeguard is the probability that an attack will result in actual damage to the company; that is, the probability that an attack will bypass or penetrate a security solution, causing harm to the institution/company. Each security solution has a bypass rate for each type of incident; a 100% bypass rate means the security solution does not stop any incidents of that type). In contrast, the security solution for mitigating Type B incidents is not as effective, with a 70% bypass rate. We begin by finding the residual risk for Type A incidents, multiplying the base risk of 60% by the bypass rate of 5%, resulting in 3%. We find the residual risk for Type B incidents, multiplying the base risk of 30% by the bypass rate of 70%, resulting in 21%. The safety margin will be the product of: (1 – 3%) times (1 – 21%) resulting in 77%. Therefore, the risk exposure will be: (1 – 77%) resulting in 23%.
Let's consider company NZPQ, which loses €50,000 for each Category A security incident, with ten Category A incidents occurring annually. Similarly, the company loses €100,000 for each Category B security incident, with two Category B incidents occurring annually. The annual loss for Category A incidents will be €50,000 multiplied by ten, equaling €500,000, and the annual loss for Category B incidents will be €100,000 multiplied by two, equaling €200,000. The base cost for Category A incidents is obtained by multiplying the annual loss (€500,000) by the base risk (60%), resulting in €300,000. The residual cost for Category A incidents is obtained by multiplying the annual loss (€500,000) by the residual risk (3%), resulting in €15,000. The base cost for category B incidents is obtained by multiplying the annual loss (€200,000) by the base risk (30%), resulting in €60,000. The residual cost for category B incidents is obtained by multiplying the annual loss (€200,000) by the residual risk (21%), resulting in €42,000.
The tangible benefit of mitigating Category A incidents is calculated by subtracting the residual cost for Category A incidents (€15,000) from the base cost for Category A incidents (€300,000), resulting in €285,000. The tangible benefit of mitigating Category B incidents is calculated by subtracting the residual cost for Category B incidents (€42,000) from the base cost for Category B incidents (€60,000), resulting in €18,000. If the company receives a €50,000 award from an association for maintaining protection against Category A incidents, then the intangible benefit of mitigating Category A incidents is €50,000. The intangible benefit of mitigating Category B incidents is zero. In this case, the total benefits are obtained by adding the tangible and intangible benefits for all incident categories, i.e.: 285,000 + 18,000 + 50,000 + 0 = 353,000 euros.
Final Considerations
Our research group has been working for over fifteen years in the area of economic feasibility analysis related to the deployment and implementation of protection mechanisms, services, and ecosystems for information security in various sectors of society, including business, IT, and networking.
This article is part of the activities carried out within the LEFIS-Thematic Network.
Bibliography
- Areitio, J. “Information Security: Networks, Computing and Information Systems”. Cengage Learning-Paraninfo. 2012.
- Areitio, J. “Evolution of Threats and Trends in Network Security in the Web Context”. Conectrónica Magazine. No. 142. November
- Areitio, J. “Identification and Analysis of Web Application Protection”. Conectrónica Magazine. No. 143. January 2011.
- Schneier, B. “Economics of Information Security and Privacy”. Springer. 2011.
- Nicastro, FM “Security Patch Management”. CRC Press. 2011.
- Norman, TL “Risk Analysis and Security Countermeasure Selection”. CRC Press. 2009.
Author:
Prof. Dr. Javier Areitio Bertolín – E.Mail:
Professor at the Faculty of Engineering. ESIDE.
Director of the Networks and Systems Research Group. University of Deusto.