By varying the arc power of multiple arcs, we can determine the desired arc power and appropriate fusion speed for the fiber being tested. This method has proven to be consistent and accurate using a new fusion splicer with a controllable plasma zone. The splicer can automatically select the correct arc power for fibers with different glass diameters. It allows optimized cutting and splicing parameters to be easily transferred to multiple fusion splicers in production lines, resulting in high-quality splicing.
1.0 Introduction
Unlike the telecommunications industry, where most glass fiber diameters are typically 125 microns, other fields (e.g., biomedical laboratories and fiber laser production lines) often use optical fiber types with a wide variety of diameters [1-3]. For fiber lasers, Large Mode Area (LMA) fibers with glass diameters of 125, 220, 300, and 400 microns are commonly used. For higher power output and transmission in fiber laser and biomedical systems, glass optical fibers with diameters of 550, 660, and 1000 microns are typical. We use glass diameter instead of cladding diameter in the test because the fiber claddings, or parts of the fiber claddings, are not glass in many large diameter fiber (LDF) designs, such as double-clad fibers (DCF), some single-mode fibers, multimode fibers (MMF), and others. Moreover, even measuring the glass diameter would not be convenient for many double-clad fibers, as their glass cross-section may be hexagonal or octagonal to break up and eliminate helical modes. The glass diameter of DCF fibers is based on the average diameter.
The wide variety of optical fibers is not only found in glass diameters. Glass fiber structures differ greatly from those used in telecommunications. The core diameter can vary from 10, 15, 20, 25, 30, to 35 microns for LMA fibers. The number of cores can also vary from one, two, to multiple cores, such as seven-core fibers. The core material can also vary. It could be made of pure silica, silica-doped germanium, or simply holes for photonic crystal fibers (PCFs). Even greater differences can be found in the cladding structure for PMF (Polarization Maintaining Fibers). Furthermore, the tension application region can take different forms, such as Panda, Bowtie, elliptical jacket, and other newly developed structures.
When dealing with a wide variety of fiber designs, fusion splicing of these optical fibers becomes both critically important and challenging.
The quality requirements for cutting and splicing differ substantially between research laboratories and production lines. In research labs, people typically work with a single splicing machine and focus on optimizing the cutting and splicing parameters to achieve better splices for a large number of different fiber combinations. However, production lines typically use a larger number of splicing machines and must consistently produce similar combinations with reliable consistency. There are two measures of cross-machine consistency and overtime consistency. The former requires consistency in applying optimized laboratory parameters to multiple fusion splicers in a production line environment. The latter requires consistency in splicing results over an extended period of repeated splicing under different cutting and splicing conditions, using the same cutting and splicing parameters.
It is relatively easy to develop splicing machines with high flexibility to produce high-performance splices in the lab.
It is much more difficult to achieve cross-machine or overtime consistency in a fusion splicer design for use on production lines. It is an even greater challenge to design for both laboratory flexibility and production line consistency.
Different diameters and fiberglass structures require different heating zones and heating powers. The new fusion splicing array family known as ARCMASTER [4] features a controllable plasma zone. With its variable electrode spacing, oscillating plasma technology, universal fiber clamping system, and special programmable functions for individual motor and arc control, ARCMaster machines provide splicing flexibility and can shape a wide variety of optical fibers. To design for the flexibility required by laboratories and the consistency required by production lines, a fundamental technique known as arc power calibration has been developed and implemented. The arc calibration method plays a critical role in ensuring splice quality by automatically selecting the correct arc power and allowing optimized splicing parameters to be transferred to multiple fusion splicers on production lines for consistent splicing results.
Over the past decade, arc calibration methods have been studied by many different fusion splicer manufacturers [5-8] to overcome inconsistent splicing results. This inconsistency stems from three main reasons. First, the tolerance of electronic components and mechanical parts can lead to cross-machine inconsistencies. Second, electrode aging and silica deposits can cause both cross-machine and overtime inconsistencies. Finally, environmental variations (pressure, temperature, humidity, etc.) cause overtime inconsistencies. To improve and resolve these inconsistencies, two categories of arc power calibration methods have emerged: the traditional melt-back method and the offset splicing method.
1.1 Traditional Meltback Method.
In the traditional meltback method, the two ends of the fibers are removed, cleaved, and aligned to a specified distance and heated by arc discharge (see Figure 1 for 125-micron fibers, see also [6]). The fiber ends are heated, and the fusion distance is measured along the fiber axes. The arc power is reduced if the fusion distance is too large, or increased if it is too small. The typical heating time is approximately 8 to 20 seconds at splicing arc power. The recommended fusion distance ranges from 100 microns to 250 microns, depending on the fiber diameter.
This process must be repeated until a suitable arc power is achieved. This method requires substantial effort in fiber preparation, especially for LDFs. On the other hand, melting large portions of fiber results in heavy silica deposits on the electrodes for LDFs larger than 250 microns in diameter. The electrode condition is significantly altered by the fusion method, making arc calibration inaccurate.
(a) Before arc discharge
(b) Arc discharge
(c) After arc discharge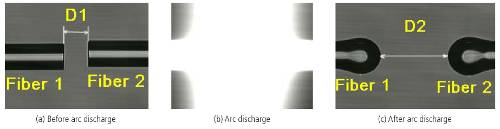 Fiber fusion causes heavy silica particles to deposit on the electrode tips for LDF fiber types, leading to inaccurate arc calibrations.
(A) Before arc discharge
(B) Arc discharge
(C) After arc discharge
Figure 2: Offset splicing method for power arc calibration. The offset variation is measured along the fiber axis by d1-d2. Fiber 1 and fiber 2 are of the same fiber type. This method works well for telecommunications fibers as small as 125 microns in diameter.
1.2 Offset Splicing Method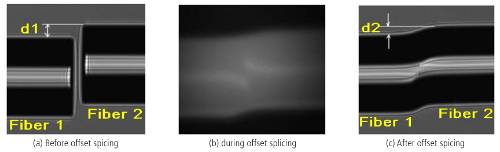 In the offset cut-and-splice method, fibers are spliced with an offset axis (see Fig. 2 for 125-micron fibers [6]). The offset variation caused by surface tension is measured. The arc power needs to be reduced if the offset variation is too large or increased if the offset variation is too small. As with the traditional fusion splicing method, this method typically requires multiple fiber preparations and splices to achieve an acceptable arc power. This method works well for telecommunications fibers, as most glass fiber diameters are consistently 125 microns.
However, the offset cut-and-splice method would not work for a large proportion of the various fiber diameter types, as the appropriate arc power would need to be established for each fiber before splicing. Therefore, this method is only applicable to fibers with a constant diameter, such as 125-micron diameter telecommunications glass fibers.
1.3 A New Variable Power Fusion Method Technology
Both the traditional fusion method and the offset splicing method described in the previous sections have some variations. For example, the fusion distance can be calculated using images of heated fibers during pre-fusion by examining the length of the light-emitting portion of the heated fiber [8]. The fusion method can also be combined with the offset splicing method [7] for telecommunications fiber types.
This article describes a new arc calibration method for a wide range of fiber sizes. This method heats the fiber with multiple short arcs of varying arc power. The fusion is then measured at the corner of the fiber ends instead of along the fiber axis. The fusion rate at the fiber corner is proportional to the fiber temperature. By varying the arc power of the multiple arcs, a suitable fusion rate and the desired arc power can be achieved for the fiber under test. This method has been successfully tested for fiber diameters from 80 microns to 660 microns on ARCMaster fusion splicers with a controllable plasma zone.
2.0 Variable Power Meltback
2.1 Variable Power Meltback Process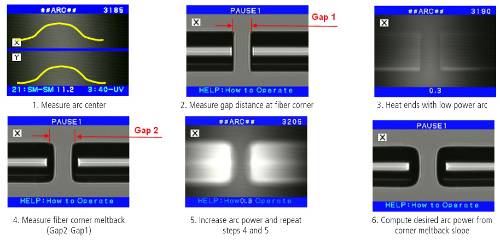 When a cut fiber end is heated by a very short arc discharge, in the range of 0.3 seconds to 1 second, the fiber end will not change shape if the arc power is too weak. If the same fiber end is heated several times using the same arc time, but gradually increasing the arc power, we can observe that at a certain power level, the corner of the fiber end will begin to round again, as shown in Figure 3.
A few key techniques are employed in the variable power meltback process. First, the arc heating time is very short and will vary depending on the fiber diameter being measured. For 125-micron diameter fibers, the arc time can be as little as 0.3 seconds, instead of the several seconds required in traditional fusion. Second, the arc power starts at a low level and is increased in small steps, just enough to prevent the fiber end from deforming too quickly. Third, corner fusion can be measured in many different ways. For example, the starting point of corner deformation can be measured, as shown in Figure 3. The change in the fiber corner radius or the variation in the corner zone can also be measured as indicators of the amount of fusion. In this article, the first definition, shown in Figure 3, step 4, is used as the fusion value.
1. Measure the center of the arc
. 2. Measure the gap distance to the fiber corner
. 3. Heat the ends with a low-power arc.
4. Measure the fusion at the fiber corner (Gap2-Gap1).
5. Increase the arc power and repeat steps 4 and 5.
6. Calculate the desired arc power from the angle of the fused corner.
Figure 3: Illustration of the variable arc power fusion method process in power arc calibration. Shaft fusion is very limited and not measurable in many cases. The electrode state is not affected by this arc calibration.
2.2 Power Arc Calibration
As shown in Figure 4, the fiber end fusion defined in Figure 3, step 4, is measured for different arc power levels and plasma zone configurations. Each curve in the figure... Figure 4 represents a fusion test, consisting of 20 to 30 re-arcs with a 0.3-second arc length, but with variable arc power. The arc power level ranged from 0 bits (~10.5 mA) to 100 bits (~14.5 mA) in 25-bit increments. Between each power increment, 5 re-arcs were performed at constant power to determine the fusion rate. Five tests were performed for each plasma zone configuration, which varied from an electrode spacing of 1 mm to 3 mm, in 1 mm increments, to verify consistency. In all tests shown in Figure 4, the SMF28 was used to compare the fusion rate and study the stability of the method.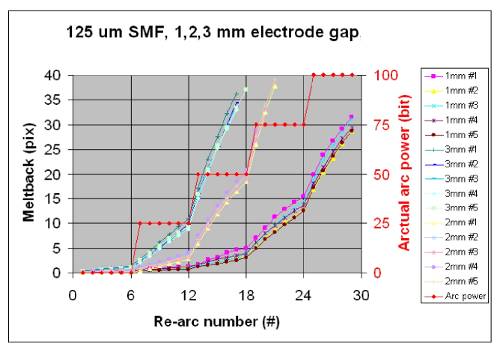 The arc power ranged from 0 bits (~10.5 mA) to 100 bits (~14.5 mA) in 25-bit increments. The plasma zone varies from an electrode spacing of 1 mm to 3 mm in 1 mm increments. Each curve represents a fusion test consisting of 20 to 30 re-arcs with an arc length of 0.3 seconds. Five tests were performed for each plasma zone configuration to verify consistency. The red curve shows the arc power. Each point on the curve represents a re-arc.
It can be clearly seen in Figure 4 that when the arc power is constant, each fusion curve increases linearly, corresponding to a constant fusion rate. As the arc power increases, the steeper slopes of the fusion curves indicate a faster fusion rate. The fusion rate can therefore be calculated in each region of constant arc power, as indicated by the red step curve. The calculated fusion rate is shown in Figure 5(a). We also observe that the fusion rate is related to the fiber end temperature. Because the melting value is measured in pixels with digital images, we can use pixels as the unit of measurement and thus measure the melting rate (related to the fiber temperature) shown by the Y-axis in Figure 5 in pixels per re-arc. Furthermore, all the 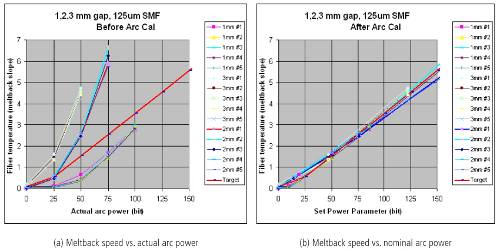 melting rate curves in Figure 5(a) can be approximated by parabolic curves, since the actual heat energy applied to the fiber end is proportional to the square of the arc current, denoted by the X-axis in Figure 5. Figure 5 also shows that a larger electrode spacing indicates a higher melting rate and a higher temperature at the fiber end. This means that in order to obtain the same temperature at the fiber end in different plasma zone configurations, we have to apply different actual arc powers.
From Figure 5, a desired target curve (in red) can be mathematically fitted. This target curve can be either a curved line or a straight line. We can use this target curve to regulate the nominal (not actual) arc power with the melting rate. The same target curve can be used for all different plasma zone configurations. A set of correction factors can be introduced to generate the same melting rate with the same nominal arc power settings. Figure 5(b) shows the same melting rate data as Figure 5(a), but instead shows the nominal arc power on the X-axis. The nominal arc power is used by operators to set their desired power. The goal of arc calibration is to project the actual arc power to the nominal arc power. In other words, we can use arc calibration to find the set of correction factors. This set of correction factors will then be used to create a new nominal arc power domain. Within the new domain, the same arc power setting will generate the same temperature at the fiber end (and therefore the same melting rate) regardless of the fiberglass diameter, electrode condition, plasma zone configuration, or ambient conditions. Calculating the correction factor is straightforward. The difference between the target curve and the measured melting rate curve can be used as the set of correction factors.
(a) Melting rate vs. actual arc power
(b) Melting rate vs. nominal arc power
2.3 Arc Calibration Results
(a1) 125 μm fiber end after arc calibration
(a2) Spliced with a 1 mm electrode gap
(a3) Spliced with a 3 mm electrode gap
(b1) 220 μm fiber end after arc calibration
(b2) Spliced with a 1 mm electrode gap
(b3) Spliced with a 3 mm electrode
(c1) 400 μm fiber end after arc calibration
(c2) Spliced with a 3 mm electrode gap
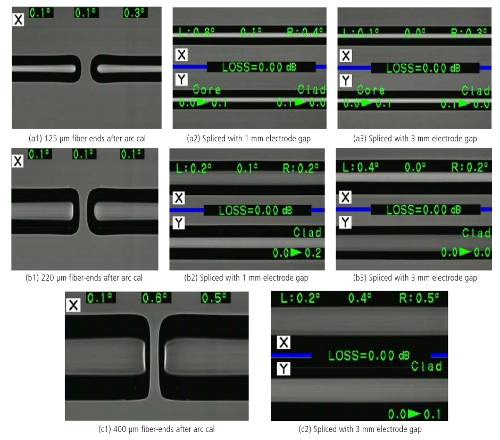 The fibers are also spliced with different plasma zone configurations. The same power rating setting is used for all the above fibers and plasma zones to obtain similar splicing results. In group (c), there are no images for a 1 mm electrode spacing because the small plasma zone is not strong enough to splice 400-micron fibers.
From the examples shown in Figure 6, we can see the results of the new arc calibration method. Using the arc calibration method described above, 125, 220, and 400-micron fibers can be spliced with the same arc power setting in different plasma zones. In other words, arc calibration operators can easily achieve the desired splicing results for different fiber types and different plasma (electrode) conditions.
For any new or unknown fiber types, engineers can easily adjust the cutting and splicing parameters using the same power setting without the tedious search for the appropriate power level.
The images of the fiber ends after arc calibration in Figure 6 also show limited core fusion and limited fiber shape distortion.
In comparison, the traditional fusion method in Figure 1(c) exhibits significantly higher levels of deformation. This new fusion method has a very limited impact on the electrode tip condition, especially for large-diameter fibers, which are prone to degraded electrode conditions when using more traditional methods.
As discussed in previous sections, both traditional fusion and offset splicing methods require multiple fiber end preparations and cuts, as cut fiber ends were no longer readily available due to the fusion or cut-and-splice process. While fiber end preparation might not be tedious for standardized 125-micron telecommunications fibers, multiple fiber end preparations for large-diameter fibers could be both expensive and time-consuming. With the new method described in this article, re-cutting is unnecessary because the arc starts from very low power and gradually increases to the desired level in a continuous re-arc process.
3.0 Summary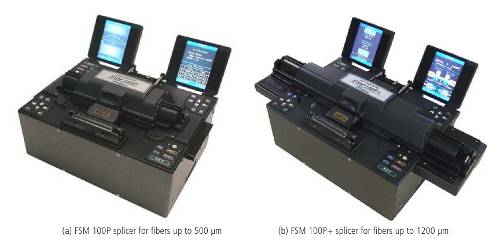 A new arc calibration method has been developed for fusing optical fibers across a wide range of glass diameters, yielding consistent and accurate results. This method heats the fiber with multiple short arcs and measures the fusion at the corner of the fiber ends. The fusion rate at the fiber corner is proportional to the fiber temperature. By varying the arc power using continuous re-arcs, an ideal fusion rate can be achieved. This ideal fusion rate represents the desired arc power for fiber testing and fusion. This method was successfully tested for fiber diameters from 60 to 1000 microns on Splice Master fusion splicers, as shown in Figure 7, with a controllable plasma zone. The method can automatically select the correct arc power for different fiber sizes. It allows operators to easily transfer optimized splicing parameters to multiple fusion splicers on production lines, resulting in consistent, high-quality splices.
(a) FSM 100P splicer for fibers up to 500 μm
(b) FSM 100P+ splicer for fibers up to 1200 μm
4.0 Acknowledgments
The authors (Wenxin Zheng and Bryan Malinsky) wish to thank N. Kawanishi and his team in Fujikura, Japan, for their support in this work, and D. Duke and S. Althoff for their constructive comments and corrections to the article.
5.0 References
[1] Dong, L., McKay, H., Marcinkevicius, A., A., Fu, L., Li, J., Thomas, B.K., and Fermann, M.E., “Extending Effective Area of Fundamental Mode in Optical Fibers,” J. Lightwave Technol. Vol. 27, pp. 1565–1570 (2009).
[2] Even, P., Pureur, D., “High power double-clad fiber lasers: a review,” Proc. SPIE – Int. Soc. Opt. Eng., 4638 pp. 1–12 (2002).
[3] Jiger, M., Verville, P., Caplette, S., Martineau, L., Brulotte DA, Gagnon, D., Villeneuve, A. “All-Fiber, Single-Stage Laser Assemblies with 91W Single-Mode, Continuous-Wave Output Power,” Quantum Electronics and Laser Science Conference (QELS), p. JWB59 (2005).
[4] Duke, D., Zheng, W., Sugawara, H., Mizushima, T., and Yoshida, K., “Plasma zone control for adaptive fusion splicing capability”, Proc. SPIE, Photonic West (2012).
[5] Zheng, W., “Automatic current selection for singe fiber splicing,” US Patent 5,909,527, Ericsson Cables, June (1999).
[6] Inoue, K., Sasaki, K., Suzuki, Y., Kawanishi, N., and Tsutsumi, Y., “Method for fusion splicing optical fiber and fusion splicer,” US Patent 6,294,760, Fujikura, Sept. (2001).
[7] Takayanagi, H., and Hatori, K., “Method for calibrate discharge energy of optical fiber splicing device,” US Patent. 7,140,786, Sumitomo, Nov. (2006).
[8] Hatori, K., “Method of determining heating amount, method of fusion splicing, and fusion splicer,” US Patent application no. 11/317899, Sumitomo, Aug. (2006).