History of ACP:
ACP measurements have been performed for many years. Initially, ACP was used for narrowband analog modulated signals and measured the ratio of the upper and lower channels to the total transmitted power. The latter was defined as the carrier power plus the majority of the power in the upper and lower channels. Currently, this measurement is defined as the ratio of one or more upper and lower power intervals to the total carrier power in the channel bandwidth.
Mobile communications have relied on ACP measurements to ensure that the power radiated into the adjacent channel is limited, so that the signal-to-noise ratio in the adjacent channel does not interfere with communications on that channel. Mobile standards, such as W-CDMA, cdma2000®, and LTE, establish measurement methods and limits that define ACP. These standards even go further and provide a descriptive name for the ACP measurement. For example, the CDMA2000 standard uses the term "adjacent channel relative power (ACPR)," and the W-CDMA standard adopted the term "adjacent channel leakage factor (ACLR)" as more specific names for the ACP measurement. GSM and EDGE have similar requirements that use the output RF spectrum (ORFS) measurement to ensure that the power radiated to adjacent channels does not exceed certain levels. Most modern spectrum analyzers incorporate presets for the various standards, allowing for quick measurement setup.
In narrowband analog modulated signals, phase noise in the local oscillator dominated the power in adjacent channels in those systems. Currently, with the introduction of wideband signals, the power in adjacent channels can be a combination of several factors, including phase noise, intermodulation distortion, and the system noise level. These factors also affect the dynamic range of the ACP that a spectrum analyzer can achieve when performing the measurement.
The result of the ACP can be expressed as follows:
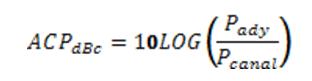
Where P<sub>ady</sub> is the power in the adjacent channel and P<sub>channel </sub> is the power in the channel.
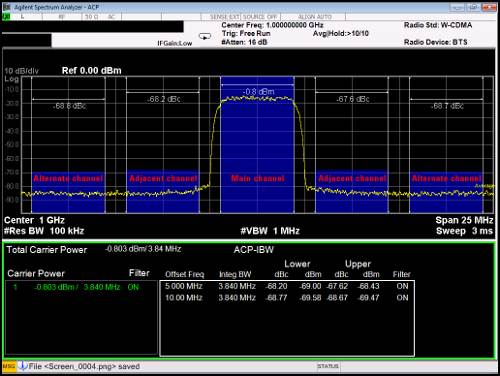
Figure 1 is a screenshot of the Agilent MXA N9020A signal analyzer performing an ACLR measurement of a W-CDMA signal. The ACLR measurement is defined as the relative power in adjacent and alternate channels with respect to the carrier power measured over a bandwidth of 3.84 MHz. The adjacent and alternate channel spacing is 5 MHz and 10 MHz, respectively. The channel powers are calculated using the integrated power method, as shown in Equation 2, where all channel trace points (dBm) are converted to mW and summed using the appropriate integration parameters.
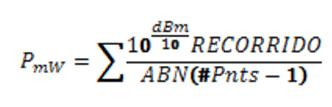
Power compensation is then applied to account for the raised cosine filter used according to the W-CDMA standard.
 Dynamic Range:
Spectral regrowth in wide-band signals in adjacent and alternating channels consists primarily of coherent and non-coherent distortion products. Coherent products are typically composed of third- and fifth-order nonlinear distortion products that develop within the device under test (DUT). Non-coherent products are noise-like in nature and originate from phase noise associated with the system's local oscillator (LO) or the device's noise level.
Spectrum analyzers are not immune to spectral regrowth. However, the amount of distortion generated can be greatly affected by the instrument settings. The third- and fifth-order distortion products generated internally in the spectrum analyzer are a function of the mixer level, which can be calculated using Equation 3.

Increasing either internal or external attenuation will decrease the internally generated coherent distortion products of the spectrum analyzer due to the reduced mixer level. However, increasing attenuation has a detrimental effect: it increases the spectrum analyzer's noise level. This makes optimizing dynamic range in PCA measurements challenging.
To optimize spectrum analyzer settings for dynamic range
, we must first understand the dynamics associated with the various distortion products before attempting to select optimal settings. Third-order distortion products will primarily appear in adjacent channels, while fifth-order distortion products will predominate in alternate channels. As the mixer level decreases and attenuation increases, the fifth-order distortion product will fall much faster than the third-order products (5:1 vs. 3:1). This will cause a rapid drop in the coherent distortion products of the alternate channels to the spectrum analyzer's noise level, while the third-order distortion products of the adjacent channels will remain above the noise level. Increasing the attenuation will now impair the PCA performance in the alternate channels, as it will increase the noise level.
The best method to balance the reduction of coherent distortion in the adjacent channels without disturbing the dynamic range of the alternate channels is to use noise corrections or noise level amplifications. First, the attenuation should be increased to reduce the internally generated distortion products in the adjacent channels until the PCA results no longer change with further attenuation. At this level of attenuation, we can be confident that we are measuring the PCA performance of the DUT in the adjacent channels. We can then employ noise corrections or noise level amplifications to reduce the incoherent noise present in the alternate channels, which originates from the spectrum analyzer's noise level.
If phase noise is the limiting factor, modern spectrum analyzers allow for optimization of phase noise in the immediate environment or at more distant points when performing measurements of standards such as Tetra, where phase noise dominates the measurement.
Measurement Uncertainty:
As with most nonlinear distortion measurements, such as harmonics, the third-order cutoff point (TOI), and the second-harmonic inversion (SHI), care must be taken to ensure that internally generated intermodulation products do not cancel the DUT distortion products. This can occur when the internally generated distortion products have an amplitude close to that of the DUT distortion product but are 180 degrees out of phase. If you observe a large improvement in your PCA results with slight changes in the input attenuation or input level, this is the most likely cause. When the amplitudes of the DUT and internally generated distortion products are equal, the measurement uncertainty ranges from +6 dB to –infinity. The uncertainty in your measurement results will be lower when the spectrum analyzer distortion products are several dB lower than the DUT distortion products. To eliminate these uncertainties, in certain cases it may be necessary to use a higher-performance spectrum analyzer.
Agilent X-Series signal analyzers incorporate the Adjust for Minimum Clip function, which can be used to automatically set the mixer level based on the input signal level. The mixer level is optimized to provide the optimal dynamic range without excessive measurement uncertainty.
Speed vs. Repeatability:
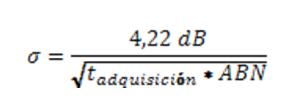
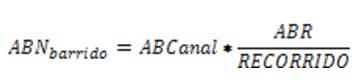
When performing a tuned sweep ACP measurement, most modern spectrum analyzers use an averaging or RMS detector to measure the power in the channels. The observed variation will be expressed as:
Where
and
 is the sweep time of the spectrum analyzer.
In many cases, the channel bandwidth, resolution bandwidth (ABR), and sweep path are fixed based on the ACP standard being measured. If repeatable results are required, the sweep time must be increased. This will have a detrimental effect on the total measurement time.
Agilent Fast Power Option:
Agilent X-Series signal analyzers offer a Fast Power option that enables rapid power measurements such as channel power, adjacent channel power, occupied bandwidth, and X-dB (FP2 option). Power measurements are first accelerated from the hardware by overlaying real-time FFT calculations in the FPGA code. The RMS average of each FFT result is then calculated to obtain the real-time spectrum on which the power results are calculated. This is an SCPI-only feature that allows users to perform measurements such as ACP directly from the hardware. For example, an ACLR result according to the W-CDMA standard can be programmatically requested from the error vector magnitude (EVM) measurement. With an acquisition time of 1 ms, a total measurement time of 3 ms can be achieved.
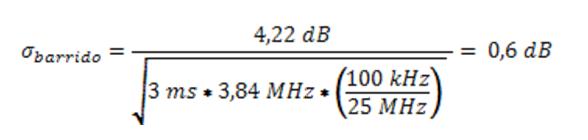
The Fast Power method improves repeatability because all channels are measured simultaneously over a much wider bandwidth. For example, we can calculate the repeatability of the sweep ACLR measurement in Figure 1. The measurement setup uses a sweep time of 3 ms, a resolution bandwidth of 100 kHz, and a channel bandwidth of 3.84 MHz over a 25 MHz path. This sweep measurement takes a total of 13 ms to complete. We can calculate the repeatability of the sweep measurement using Equation 4.
We can now compare the repeatability and measurement time of the sweep example with those of the Fast Power method using an acquisition time of 1 ms and a total measurement time of 3 ms. For Fast Power, we can use the following relationship:
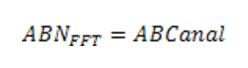
Therefore, the repeatability of Fast Power is:
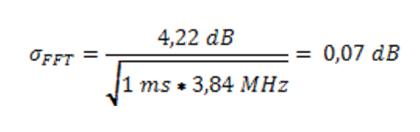
In summary, Fast Power allows for ACLR measurements that are four times faster and nine times more repeatable compared to the sweep measurement.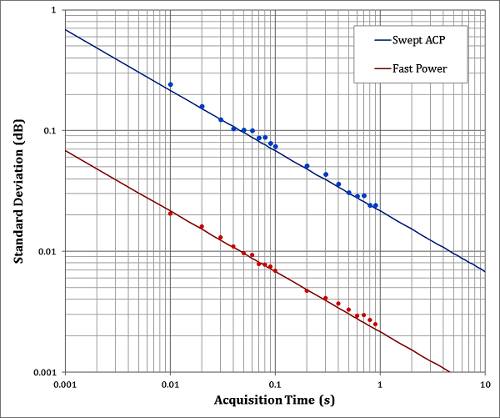 Figure 2 shows various repeatability values for ACLR measurement acquisition times with tuned sweep and Fast Power. The blue and red lines are the theoretical results from Equation 4.
Tuned sweep measurements will always provide a higher dynamic range because they use a narrow-bandwidth analog IF filter. This narrow IF bandwidth filter provides a much lower peak power (observable at the ADC) than when the entire bandwidth is measured at once, as with Fast Power. If dynamic range is a critical requirement, the tuned sweep ACLR measurement should be used. If measurement speed and repeatability are necessary in an automated test environment where maximum dynamic range is not the dominant factor, the Fast Power option on Agilent X-Series signal analyzers is far superior to other methods.
Abstract:
This article addresses several issues related to performing ACP measurements. As modulation standards evolve, other measurements, such as spectrum emission masking (SEM), will allow users to gain more insight into the linearity of their DUT. These measurements, combined with linear distortion measurements such as error vector magnitude (EVM), will ensure that end users of the equipment enjoy better communications and make cleaner use of the limited spectrum.
Author: Bob Nelson, Agilent Technologies, Inc.
Note: cdma2000 is a U.S. registered certification mark belonging to the Telecommunications Industry Association.