 Fundamentals of PDL measurement
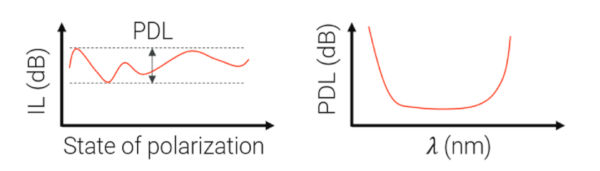
The PDL is defined as the maximum variation in insertion loss of a DUT when the input SOP is varied in all possible polarization states. The PDL can be measured at a single wavelength and also as a function of wavelength.
Two different approaches to measuring PDL are described below. The all-state method detailed below is a step-by-step measurement, while the Mueller method can be applied in a sweep measurement.
All-State Method:
The all-state method uses a bias encoder or bias controller to generate a large number of bias states with a deterministic or non-deterministic pattern.
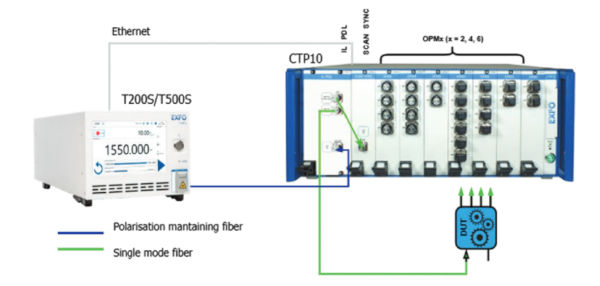
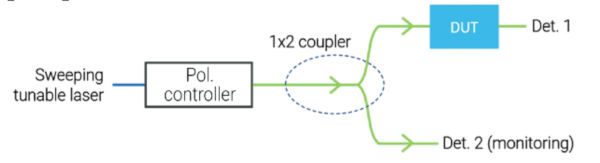
The all-state configuration shown in the following figure is particularly valued for its simplicity and accuracy.
 Accurate PDL measurement requires an optical source with excellent power stability, as well as a polarization encoder with low activation loss and good Poincaré sphere coverage. A measurement time of several seconds per wavelength is typical and can be prohibitively expensive when fine resolution or a wide wavelength range is required. In such cases, sweep measurement using the Mueller method is preferred.
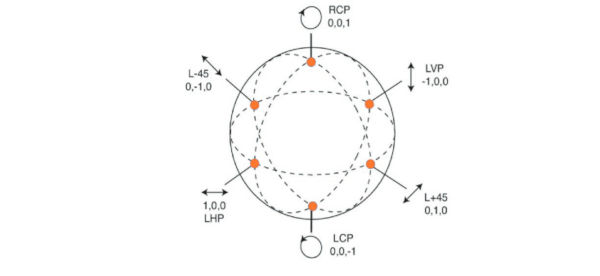
The Mueller calculation allows the determination of the PDL of a DUT from insertion loss values measured with well-known 4- or 6-state input SOPs. This method is well-suited for measuring PDL values up to 20 dB and is based on 4 or 6 orthogonal polarization states for PDL calculation. Small deviations from perfectly orthogonal SOPs can be compensated for if the relationship between the different states is well-known.
 A polarization controller or polarization state generator is combined with a tunable scanning laser to enable a scanning insertion loss measurement for each polarization state. This method dramatically reduces measurement time and allows for high resolution over a wide range of wavelengths.
Most polarization controllers rely on waveplates to generate the required SOP. Regardless of whether zero-order or multi-order waveplates are used, these optical components exhibit a certain wavelength dependence that cannot be ignored. With step-by-step measurements, the polarization controller's wavelength parameter can be updated after each step, ensuring accurate results.
 However, this is not possible in scanning measurements, where the laser is continuously swept across the wavelength range. In this case, the generated polarization state typically deviates from the desired SOP in an unknown way.
CT440-PDL
system is a passive component tester designed for components with up to four outputs. It works with any of EXFO's tunable lasers to perform IL and PDL sweep measurements with the configuration shown in the following figure. The CT440-PDL integrates an internal PSG that can generate the six well-defined and nearly orthogonal SOPs required for the 4/6 states of the Mueller calculation. This PSG is wavelength-calibrated, so the SOP generated during the sweep is always well-known.
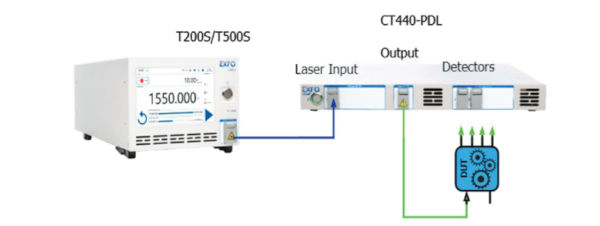 The CT440-PDL's four integrated detectors allow for simultaneous measurement of the four-channel transfer function. An internal monitoring photodetector is also placed upstream of the DUT to compensate for any power variations from the laser source. Once the IL traces for each SOP are complete, the PDL data is compiled internally by the CT440-PDL. The wavelength dependence of the PDL is compensated for using calibration coefficients stored within each CT440-PDL. This procedure is automatic when using the GUI. Alternatively, the PDL data can be retrieved remotely using the DLL file.
PDL Measurements with the CTP10 Platform:
The CTP10 can be configured to simultaneously measure the IL and PDL of devices with a large number of ports (1xN with N ≥ 2) using the high-performance OPM2 IL PDL module and the CTP10 platform's multiport detection system. The module performs IL and PDL measurements in the 1240 nm to 1680 nm range and has two optical detectors. The module also enables high-resolution measurements in the SCL band. It generates the SOPs, 4 or 6, required for PDL calculations.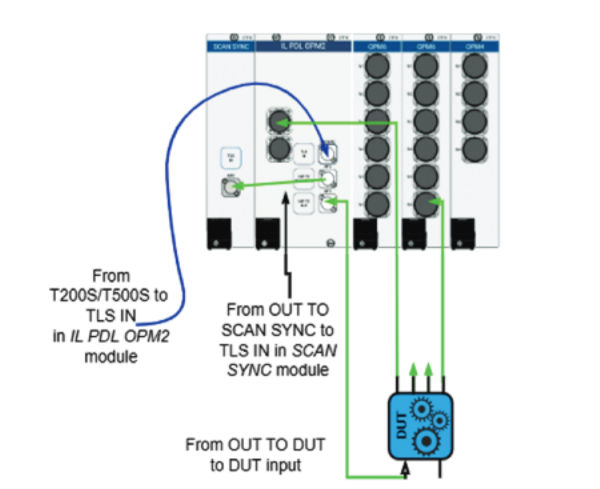 The following figure shows the fiber connections in the CTP10 in the configuration of Figure 1 in more detail. The T200S/T500 laser output fiber is connected to the laser input (TLS IN) of the OPM2 IL PDL module via a PM fiber. Real-time power monitoring is performed internally in this module to ensure accurate insertion loss measurement. Two single-mode fibers connected to the module's output ports are connected to the DUT and the SCAN SYNC module for optical wavelength triggering during scanning.
Performing accurate PDL measurements requires special attention. The following points highlight some best practices to ensure optimal performance:
- Care must be taken with the single-mode fiber running from the module output to the DUT input. Environmental changes, such as vibrations or temperature, will affect the fiber's local birefringence and, consequently, the SOP reaching the DUT. This can affect the accuracy of the reference measurement or the relative SOP between successive scans.
- A reference measurement without a DUT is required for each SOP and for each channel.
- The CTP10 platform's optical power meters utilize clearance between the ferrule and the photodiode. Unconnected APC connectors (angle-set glass-to-air interface) contribute approximately 0.02 dB of PDL, which will be measured by the system and cannot be referenced. For PDL measurement, optimal performance is achieved with PC connectors on the power meters.
The following subsection shows the results obtained with a 1x1 DUT. Multiport DUTs can be characterized similarly thanks to the multiport detection system of the CTP10 platform.
CWDM Multiplexer
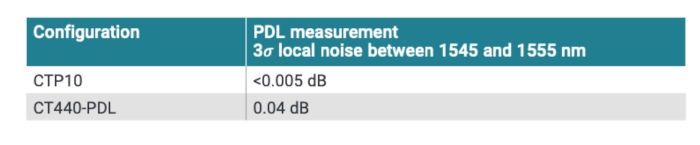
The 1550 nm channel of a CWDM multiplexer was measured based on the configuration shown in Figures 1 and 6. The following figure shows the PDL measured with the CTP10 and CT440, as well as the insertion loss (i.e., the transfer function) of the DUT.
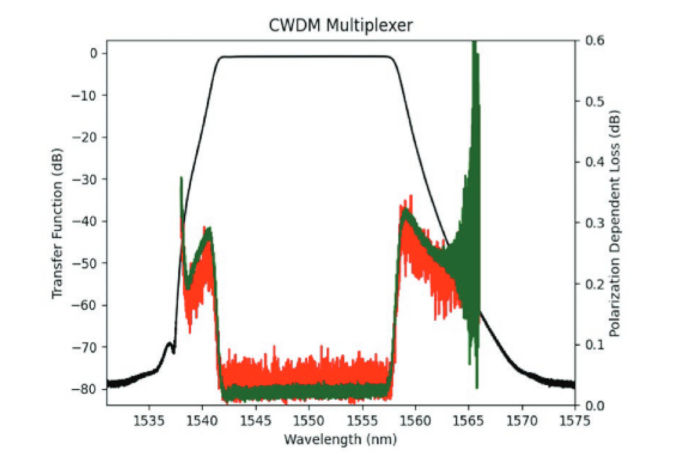 Good agreement was observed between both PDL measurements. PDL values in the stopband region were intentionally removed as they were less relevant and were calculated from high IL values.
The noise level of the PDL trace measured with the configuration using the CTP10 is considerably improved thanks to a more resolved and accurate transfer function measurement compared to the CT440-PDL.
Conclusion
The IL and PDL measurements can be performed using the configuration shown in Figures 1 and 6. The performance of the CTP10 system provided low-noise PDL traces that allowed PDL values of less than 0.01 dB to be measured in the passband region of the measured CWDM filter, compared to less than 0.1 dB when using the CT440-PDL.