Technological advances have presented new challenges in the past and fostered innovation in metrology. For example, high-performance engines have very tight tolerances in terms of clearances and other physical attributes. The product concept developed in the laboratory can only become a reality if these clearances can be measured with impressive precision and accuracy. Using less stringent measurement methods would result in brilliant concepts that would never reach the production stage or the road.
This concept is equally valid in a wide variety of fields. First-generation measuring equipment must evolve to meet the increasingly stringent requirements of advanced functional applications. The challenge for metrology specialists is to innovate and develop intelligently designed measurement systems capable of supporting the evolving needs of the product being evaluated.
The demand for higher-speed optical communication systems for building applications has driven the development of significant improvements in multimodal fiber optic measurement technology. Overfilled Launch (OFL) bandwidth measurement, long the standard for characterizing multimode fiber performance, lacked the accuracy and relevance to functionality required for attribute evaluation. Although OFL bandwidth provided a result in megahertz (the traditional standard in optical and copper applications), its lack of relevance to functionality in high-speed LED and laser systems spurred the search for improved bandwidth measurement methods. With 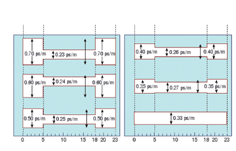 the advent of the OM3 standard (50/125 µm multimode fiber optimized for 850 nm lasers), OFL bandwidth has given way to a more accurate fiber measurement method called Differential Mode Delay (DMD). DMD results, recognized as "pure fiber measurement," have been adapted to evaluate fibers suitable for use in high-speed (≥ 1 GHz) applications.
More Than Just Feedback
: Historically, DMD measurements have been limited to processing feedback, rather than performing performance evaluations. From its inception, DMD has been primarily used as a process evaluation and tuning tool. The measurement provides detailed information about the relative delays between the modal groups of a fiber. However, to process control and feedback, a highly accurate or sophisticated measurement was not required, so a typical DMD system lacked the capacity to evaluate fiber bandwidth or its operational performance.
 But as the OM3 standard developed, the application of this process feedback tool became established as a system for evaluating fiber bandwidth performance. During the standards development, a method was sought to evaluate fiber performance based on DMD results. The first test developed was the use of DMD masking templates, or DMD masks, which consist of six unique templates. Each template allows a defined amount of differential-mode delay in picoseconds per meter (ps/m) as a function of its radial location on the fiber. Each template has an inner and outer mask, as well as four sliding masks that must meet the OM3 designation criteria.
However, before evaluating DMD data against each template's masks, the raw data is processed to condition the results. These conditioning steps help overcome significant flaws in measurement systems at the expense of the evaluation capabilities of the fiber selection method.
The clearest example of the limitations of the DMD evaluation process is the use of the FWQM amplitude (full width at one-quarter of the maximum) to define the differential mode delay between the initial and delayed pulses. Using FWQM allows the DMD mask to ignore all initial and follow-through signals with an amplitude less than 25 percent.
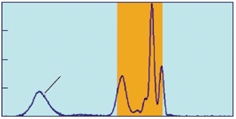
Figure 3 (DMD Response for a Single Offset Injection) shows an example of this filtering. The drawing shows the normalized output of a DMD probe at a single radial position on the core. The received power is normalized to the maximum power of the pulse response, and the initial and delayed FWQM points at that location are identified. In this example, an initial pulse has a normalized amplitude slightly less than 25 percent of the maximum, so the entire pulse is ignored when determining DMD and is not applied to the masking templates. However, omitting this initial pulse could affect actual system performance and link functionality in a high-speed system.
Manufacturing Cost vs. Accuracy:
It is evident that this conditioning step can omit or minimize the impact of significant response attributes that could affect system performance. In addition to omitting leading or delayed pulses and other received signals below 25 percent of the normalized maximum, the use of FWQM filtering can allow measurement systems to have excessive optical and electrical oscillation. 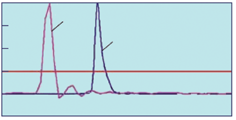 Therefore, results obtained with less robust measurement systems can be used to determine their suitability for the DMD mask, since spurious signals below 25 percent of the normalized maximum power are ignored. Although these systems can reduce manufacturing costs, this reduction comes at the expense of measurement precision and accuracy, which could lead to functional performance problems.
Other special measurement adaptations are incorporated into the use of the DMD mask, such as the arithmetic removal of the reference signal. This removal increases convenience at the expense of accuracy. To properly eliminate the measurement system response and isolate the fiber response, the reference pulse must be deconvolved from the received pulse response in a manner consistent with LTI (linear time-invariant) systems theory.
Simple arithmetic subtraction of the reference pulse can lead to a lack of scalability in mask results. For example, two measurement systems, each with different timing responses, may produce different results for the same fiber. The mask may appear suitable through simplistic arithmetic subtraction of the reference, while more suitable measurements with deconvolution may indicate that the fiber is not capable of high-speed system performance. 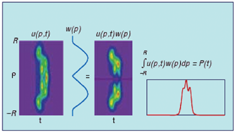 The DMD mask also presents challenges regarding its ability to ensure compatibility between all fibers and all standard-compliant transmitters. Each template supports a variable amount of mode delay as a function of its radial position on the core. The variable time delays in the inner and outer regions represent the different levels of rigidity of the requirements to be met, according to the dot size characteristics of the transceivers used in high-speed systems.
DMD results only require passing one of six masking templates to qualify a fiber as OM3, but this can lead to functional problems in the application. Real-world systems use 850 nm VCSELs (vertical cavity surface emission lasers) with defined EF (inscribed flux) limits. These limits define the amount of light that must be injected at a specific radial location within the fiber core. For OM3 fibers, VCSELs might emit up to 30 percent of their power within the first 4.5 µm of the core radius and at least 86 percent of their light within the first 19 µm of the core radius.
Obviously, certain combinations of VCSELs with fibers passing through a particular mask could lead to performance problems. For example, coupling an active external VCSEL source with a fiber that has higher modal dispersion capability at higher radial positions could compromise the system's link performance.
Furthermore, the mask only applies to the first 23 µm of the radius for a fiber with a 25 µm core radius. Although VCSELs may have a slightly smaller injection point than traditional sources (e.g., LEDs), the mode delay at the higher radial positions should not be ignored.
 Typically, a multimode fiber receives a measured value that describes its bandwidth performance. Broadband users are unfamiliar with DMD mask results. If a mask value is specified, the fiber is assigned a set of delay values in picoseconds per meter (ps/m). In some cases, only a pass/fail result against the OM3 specification can be provided, without additional measurement data. While delay values may not be convertible to a more familiar bandwidth value, their meaning and scalability are not the same as the standardized, proven MHz•km values common in the optical and copper cable communications industries.
The inherent limitations of the DMD mask have driven the bandwidth measurement community to seek innovations. End users needed a familiar bandwidth value in MHz•km that clearly indicated throughput capability and guaranteed performance in a high-speed optical system with approved VCSELs. DMD measurement remained the most effective system available for characterizing fiber, but it needed to be significantly improved through innovations that would allow the desired goal of a real bandwidth value to be achieved.
The new measurement and the resulting output needed to have sufficient dynamic range and frequency response capabilities to allow its use in a higher-power measurement system. If the DMD output results were sufficiently refined and robust, they could be added to the light spot profile from the actual transceivers, providing a reliable calculated bandwidth value. For convenience, the VCSEL vendors had defined EF (efficiency) constraints, so the distribution of optical energy injected into the fiber was well understood. Combining these two attributes (fiber DMD and VCSEL injection energy location) seemed to offer the path to a more optimized measurement system.
DMD results only need to pass one of six masking templates to qualify a fiber as OM3, but this can cause functional problems in the application. Actual systems use 850 nm VCSELs (vertical cavity surface emission lasers) with defined EF (efficiency) limits. These limits define the amount of light that must be injected at a specific radial location within the fiber core. In the case of OM3 fibers, VCSELs could emit up to 30 percent of their power within the first 4.5 µm of the core radius and at least 86 percent of their light within the first 19 µm of the core radius.
Obviously, certain combinations of VCSELs with fibers passing through a particular mask could lead to performance problems. For example, coupling an external active VCSEL source with a fiber that has higher modal dispersion capability at higher radial positions could compromise the satisfactory performance of the system link.
Furthermore, the mask only applies to the first 23 µm of radius for a fiber with a 25 µm radius core. Although VCSELs may have a slightly smaller injection point than traditional sources (e.g., LEDs), mode delay at higher radial positions should not be ignored.
A multimode fiber typically receives a measured value describing its bandwidth performance. Broadband users are unfamiliar with DMD mask results. If a mask value is specified, the fiber is assigned a set of delay values in picoseconds per meter (ps/m). In some cases, only a pass/fail result against the OM3 specification can be provided, without additional measurement data. The delay values may not be convertible to a more familiar bandwidth value, but their meaning and scalability are not the same as the standardized, proven MHz•km values common in the optical and copper cable communications industries.
The inherent limitations of the DMD mask have forced the bandwidth measurement community to seek innovations. End users needed a bandwidth value they were familiar with, in MHz•km, that clearly indicated throughput capacity and guaranteed performance in a high-speed optical system with certified VCSELs. DMD measurement remained the most effective system available for characterizing fiber, but it needed significant improvement through innovations that would enable the desired goal of a real bandwidth value.
The new measurement and the resulting output needed to have sufficient dynamic range and frequency response capability to allow its use in a higher-power measurement system. If the DMD output results were sufficiently refined and robust, they could be added to the light spot profile from actual transceivers, yielding a reliable calculated bandwidth value. For convenience, VCSEL vendors had defined EF constraints, so the distribution of optical energy injected into the fiber was well understood. The combination of these two attributes (fiber DMD and VCSEL injection energy location) seemed to constitute the way to achieve a more optimized measurement system.
Emergence of EMBc:
Fiber providers found the solution to this problem in EMBc (Effective Modal Bandwidth Calculated). EMBc is a measurement system that allows the calculation of a single bandwidth value for any combination of fiber and optical source energy distribution, whether measured from an actual transmitter or derived theoretically for a defined optical source distribution (EF). The EMBc measurement method was the second
evaluation metric system incorporated into the OM3 standards.
EMBc calculations increase the performance level of DMD measurement systems. Creating an EMBc-ready DMD measurement system requires hours of engineering design and careful component selection. Unlike the DMD mask, which ignores the energy of output pulses below 25 percent amplitude, EMBc uses the entire received optical signal to calculate the bandwidth value. Therefore, noise sources, source/detector oscillation, and other spurious measurement devices must be eliminated or greatly reduced.
A DMD system prepared for EMBc must use laser sources (typically a Ti:sapphire laser), detectors, and high-performance optical and mechanical peripheral components. An exceptionally small spot size must be used for the probe signal to ensure that group delays are accurately measured at each specific location within the fiber core. Furthermore, to obtain a precise and accurate EMBc, it is essential to employ particularly careful practices, such as precise centering of the probe fiber relative to the fiber under test, appropriate selection of the oscilloscope's time bracket, suitable time sampling techniques, and complete collection of all received power.
The EMBc value is applied differently to the DMD mask. Although a fiber is required to pass a single mask to be classified as OM3-capable, it must have EMBc values (bandwidth in MHz•km) above a defined threshold value when evaluated with the injection power distribution of 10 representative VCSELs. The 10 injection power distributions fully cover the EF specification for OM3-enabled VCSELs described above. Any small delay fault in the fiber's DMD profile or excessive mode delays in any localized area would result in a significant reduction in EMBc. This is contrary to the application of the DMD mask, which ignores signals below 25 percent of the normalized maximum.
The minimum of the 10 EMBc values is used to establish the pass/fail measure of the record (called the calculated minimum effective modal bandwidth, or minEMBc). This ensures that the worst possible match of fiber DMD and source VCSEL conservatively defines the fiber's performance. Therefore, minEMBc is a much more rigorous test of suitability and functionality than the DMD mask.
fully
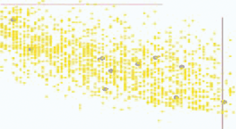
A closer examination of Figure 6 (Sources for the TIA model) shows that there is a wide range of suitable transmitter EF values, ranging from center-active (with optical power close to 30 percent at 4.5 µm) to outer-active (barely 86 percent optical power at 19 µm). The 10 weightings
represent the theoretical transmitter distribution considered in determining the OM3 specifications.
Independent evaluations of transmitter EF distributions have confirmed the suitability of using these 10 standard weightings relative to the overall distribution of real sources. In fact, these studies have uncovered another point about transmitter EF distributions. Some recent work suggests that the most limiting sources (Sources 1 and 5, as seen in Figure 5, EMBc Calculation) are uncommon in the real transceiver population. A review of actual minEMBc results on production fibers This reveals that these two weightings produce the vast majority of minEMBc values. In other words, it is highly unlikely that the sources producing the minEMBc values will appear in a real-world system. This fact provides minEMBc with an additional layer of security, as the most common sources tend to have an EMBc result much higher than the minEMBc value. Furthermore, minEMBc is very robust and can be easily adapted to new standards and transceiver distributions as new sources and applications become available.
Improved performance standards for DMD measurement systems can explain how EMBc evolved, but they do not address the most important requirement of a fiber's attributes: their relationship to system functionality. As stated earlier, a multimode optical fiber only needs to satisfy one of the six masking templates to meet OM3 requirements. The maximum DMD in any isolated fiber can vary between 0.33 and 0.7 ps/m, depending on which masking template the fiber satisfies. If a fiber passes a masking template Specifically, for example, it could be paired with a VCSEL that is not optimized for a fiber with that particular DMD profile. As a result, the correlation between mask performance and actual system functionality can be problematic.
However, EMBc utilizes the two most significant link data points: the fiber's DMD profile and the VCSEL light source characteristics. The minimum EMBc of 10 different lasers is used to certify OM3 performance. Using the most conservative EMBc values provides maximum assurance that the fiber will operate as intended when paired with a standards-compliant VCSEL in an optical link.
Evaluating minEMBc as a function of a system's BER or dispersion penalty might lead one to believe that this metric is not fully correlated with all VCSEL sources. Since the minEMBc value represents the recorded bandwidth measurement, a fiber meeting this requirement will be fully compatible with the entire range of standards-compliant transceivers. Each unique, standard-compliant VCSEL will have its own unique EF, which will provide a unique EMBc. The specific EMBc is typically much higher than the requirements specified for OM3 fibers. Consequently, fibers with suitable minEMBc will yield satisfactory results in OM3 systems when paired with a compliant transceiver.
However, comparing BER or dispersion penalty for a specific link may not correlate well with the fiber's minEMBc value. To optimize the correlation with BER and dispersion penalty, comparing EMBc and system performance should utilize weighting for the VCSEL under study.
Some recent technical studies reflect a trend toward evaluating system performance based on the EMBc calculated for a given source/fiber combination, rather than using the highly conservative minEMBc value. Future work is planned to demonstrate the correlation of specific source fiber/EMBc with system performance attributes such as power penalty or bit-to-error ratio.
Alternative Methods
If imitation is the sincerest form of flattery, EMBc has reason to blush. Industry standards organizations have recently agreed to develop OFLc (calculated saturation bandwidth) as an alternative measurement method for OFL bandwidth. OFLc will use a fiber's DMD and an agreed-upon weighting to calculate the OFL bandwidth value. This method will eliminate the tremendous variability in OFL bandwidth values due to permissible variation in saturation injections and other benchmark differences in measurement systems.
While it may not make OFL a more functional measurement, it should encourage agreement in terms of measurement systems when comparing DMD systems of equal capacity.
The authors
Jeffrey Englebert is supervisor of the Optical Fiber Testing Center and Steven Garner is a multimodal measurement engineer at Corning Optical Fiber
Reproduced from the February 2009 issue of CABLING INSTALLATION & MAINTENANCE, with formatting revisions.
Copyright 2009 PennWell Corporation