Optical Signal Polarization-Based Technique: The first technique we will study involves signal-to-noise discrimination using optical signal polarization. The laboratory setup is shown in Figure 1. As can be seen in this figure, a tunable laser and an ASE noise source are used to simulate different OSNR values. The OSNR can then be easily adjusted using attenuators located at the output of these optical sources. Subsequently, the optical signal is filtered and applied to the input of the monitoring block. Since this optical signal can have an arbitrary polarization state, the first step is to obtain linear polarization using a quarter-wave plate. In this case, the signal should reach a linear polarization state four times per revolution of the plate (which rotates at a frequency of 15 Hz). A linear polarizer, which also rotates but at a much slower speed (specifically, at a frequency of 0.1 Hz), is placed at its output. Therefore, the signal power (along with the ASE noise) can be measured whenever the polarized signal from the quarter-wave plate is aligned with the linear polarizer. Conversely, the noise power (half the total ASE power) can be measured at the times when the polarizer is orthogonal to the output signal from the quarter-wave plate.
As a result, 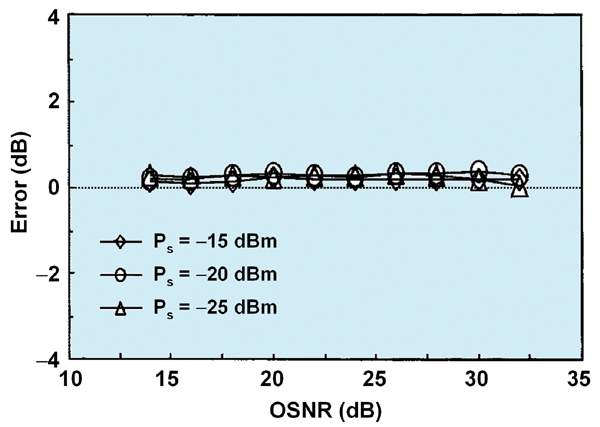 the signal level at the photodetector output will fluctuate periodically between maximum and minimum values. From these values, the OSNR can be easily calculated. A logarithmic amplifier can be used to increase the dynamic range of the measurement. Finally, it should be noted that the accuracy of the measurement depends on the rotation speed of the quarter-wave plate. Specifically, it must rotate at least 150 times faster than the polarizer to ensure alignment better than 1.2° (0.2 dB accuracy in a 25 dB OSNR measurement). The setup in Figure 1 meets this requirement, allowing the measurement of the signal and polarized ASE noise every 2.5 seconds. Figure 2 shows comparative results of the error incurred by this method with respect to OSNR measurement based on OSA.
RF Subcarrier-Based Technique:
This monitoring technique involves using an RF subcarrier that is multiplexed (subcarrier multiplexing, or SCM) with the baseband data signal to monitor the degradation it undergoes. Several methods have been proposed for generating hybrid baseband/SCM signals. These 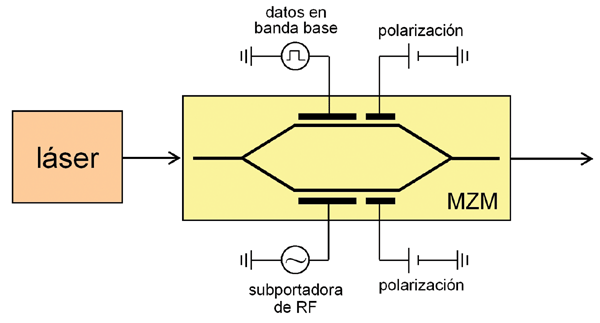 include electronically combining both signals as a preliminary step to direct laser modulation, or electro-optically combining them using a dual-feed Mach-Zehnder modulator. The latter method is schematically represented in Figure 3. The digital signal containing the baseband data is applied to one arm of the modulator, while the other arm is fed with the RF subcarrier. The subcarrier frequency must be high enough to avoid being affected by the data signal, while its amplitude must be low enough to avoid inducing excessive power penalty on the data. In some cases, this subcarrier is also amplitude-modulated to provide additional information.
The detection and demultiplexing of the SCM signal to be monitored can be performed at any point in the network by diverting a small fraction of the optical power. Detection of the RF subcarrier involves either electrical filtering after photodetection or optical prefiltering before the photodetector. The advantage of the second method is that it avoids the fading of the RF signal due to chromatic dispersion (carrier suppression effect). Subsequently, the OSNR of the optical channel can be estimated from the CNR measurement of the RF subcarrier using the following equation:
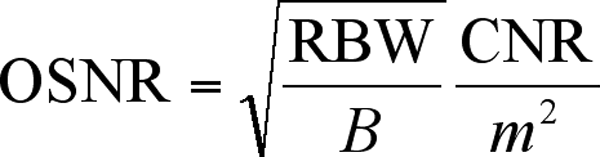 where B is the optical bandwidth, m is the subcarrier modulation index, and RBW is the resolution bandwidth of the electrical spectrum analyzer (ESA) used to measure the CNR. However, for the estimate to be accurate, the photodetector noise must be negligible, and the predominant optical noise must be the spontaneous emission beat noise from the optical amplifiers.
Figure 4 shows the laboratory setup for the RF subcarrier-based OSNR monitoring technique. The tunable optical filter allows the selection of the 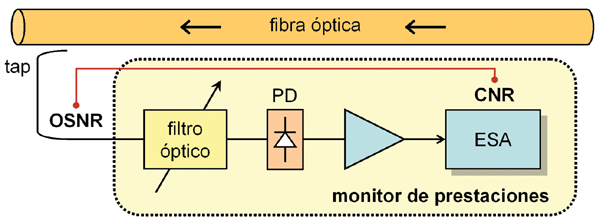 WDM channel to be monitored. At the photodetector output, the signal is amplified by a broadband amplifier and captured by a spectrum analyzer to measure its CNR. However, to monitor multiple WDM channels simultaneously, the scheme shown in Figure 5 can be used. In this case, each channel uses a different subcarrier frequency, so that when the optical signal is photodetected, an SCM signal is obtained with the RF subcarriers of all the channels. Each of these subcarriers is then down-frequencyed to an intermediate frequency and detected by Schottky diodes. The drawback of this setup, however, is that the RF signals can be affected by chromatic dispersion in the link. Therefore, in addition to the fiber's own attenuation, several transmission nulls will appear
 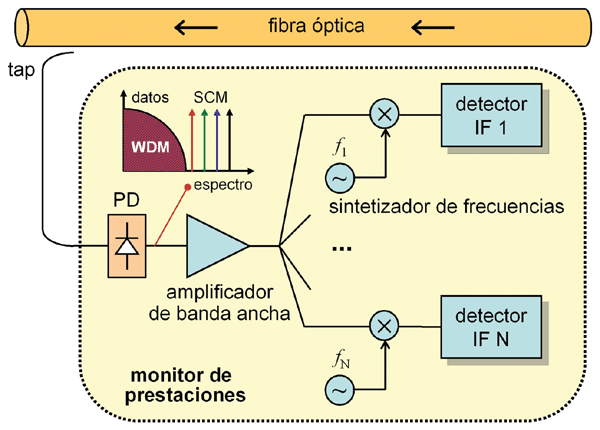 due to destructive interference phenomena that occur when photodetecting the subcarrier in the presence of accumulated chromatic dispersion. To avoid this, a possible solution would be to use single-sideband modulation at the transmitter.
Finally, to estimate the accuracy of the technique, comparative measurements were performed with the OSA-based method (G. Rossi, et al., JLT, vol. 18, no. 12). Errors of less than 1 dB were obtained for OSNRs below 20 dB, which worsened as the OSNR value being measured increased. Therefore, we can conclude that the accuracy obtained is worse than that achieved with the polarization-based technique. However, its advantages include greater simplicity and the ability to monitor several channels simultaneously.
Francisco Ramos Pascual. PhD in Telecommunications Engineering.
Full Professor at the Polytechnic University of Valencia.